July 1st, 2022: I present to you an in-depth analytical review on Gopher players from the 2021-2022 season, what I tracked, how, and why.
–> Follow @Dylanloucks4 on Twitter
MINNEAPOLIS, MINN –When the season started I stated I would be tracking analytics for the whole season as well as covering the team. But what are analytics and what did I track?
A year ago I created my very own expected goals model and halfway through the season I worked on creating an evolving defensive model. The defensive model was an idea for me to see what Gophers were defensively sound. The expected goals model was essentially the opposite of the defensive one. Let’s dig in.
The simple dictionary definition of hockey analytics is, “the analysis and characteristics of hockey players and teams through the use of statistics and other tools to gain a greater understanding of the effects of their performance.”
Breaking it down in terms of my models, these analytics show us and back up our eyes as to what players shine in what kind of categories. For example, Gophers center Jaxon Nelson finished the year with a -3 plus-minus. A player is awarded a ‘plus’ each time he is on the ice when his Club scores an even-strength goal and he receives a ‘minus’ if he is on the ice for an even-strength goal scored by the opposing Club.
To some, the stat plus-minus is used to assess a player’s value to a team. If a player’s plus-minus is a positive number, one can conclude the player provides offense and is great at keeping the puck out of his own net. So that would mean if a player’s plus-minus is negative he must not be good defensively and not provide much offense.
Well, expected goals and the model itself completely destroys that theory. Analytically, Nelson was one of the best defensive forwards on the Gophers this season. His value to the team was much higher than the -3 plus-minus he finished with. In the expected goals model you can track a single player’s xGOPP, which is the opponent’s expected goals when said player is on the ice.
Nelson carried a 2.3 xGOPP/60. This means the opposition technically scored 2.3 goals per 60 minutes when Nelson was on the ice. That ranked fourth on the Gophers during the 2021-22 season. Nelson will be entering his senior year, first as a captain and will carry a key role in the Gophers’ top-six next season.
So what’s my model?
My Expected Goals Model
There are tons of different expected goal models out there and a lot that are very reliable, but I decided to make my own and implant it on this Gophers’ hockey team. I’m not going to give away my model and values for obvious reasons but I’ll highlight the five key features and what values are assessed on each play.
My model takes into account shot type, shot location, shot distance, rush chance, and if the play started six seconds before or after a giveaway or takeaway. Most models out there use the first four listed above and only a select few use the last one listed in the model. What is different with my model is the value that is assessed for each play. The plays that get assessed a value are the basic shots like a snapshot, wristshot, backhand, and slap shot. Then you have plays like a tip-in, wraparound, and rebound. Each one of these seven types is assessed with a number value.
Those are just values for shots though, a rush chance is assessed a value, so is where the shot was taken, how far away it was shot from, and so on. You get the idea.
There are numerous of wonderful hockey analytics sites out there that fans can access to view player analytics but unfortunately, those seem to only be available on NHL players. So finding NCAA analytics is a bit harder to find, hence why I created my own model and tracked stats on the Gophers.
The Results
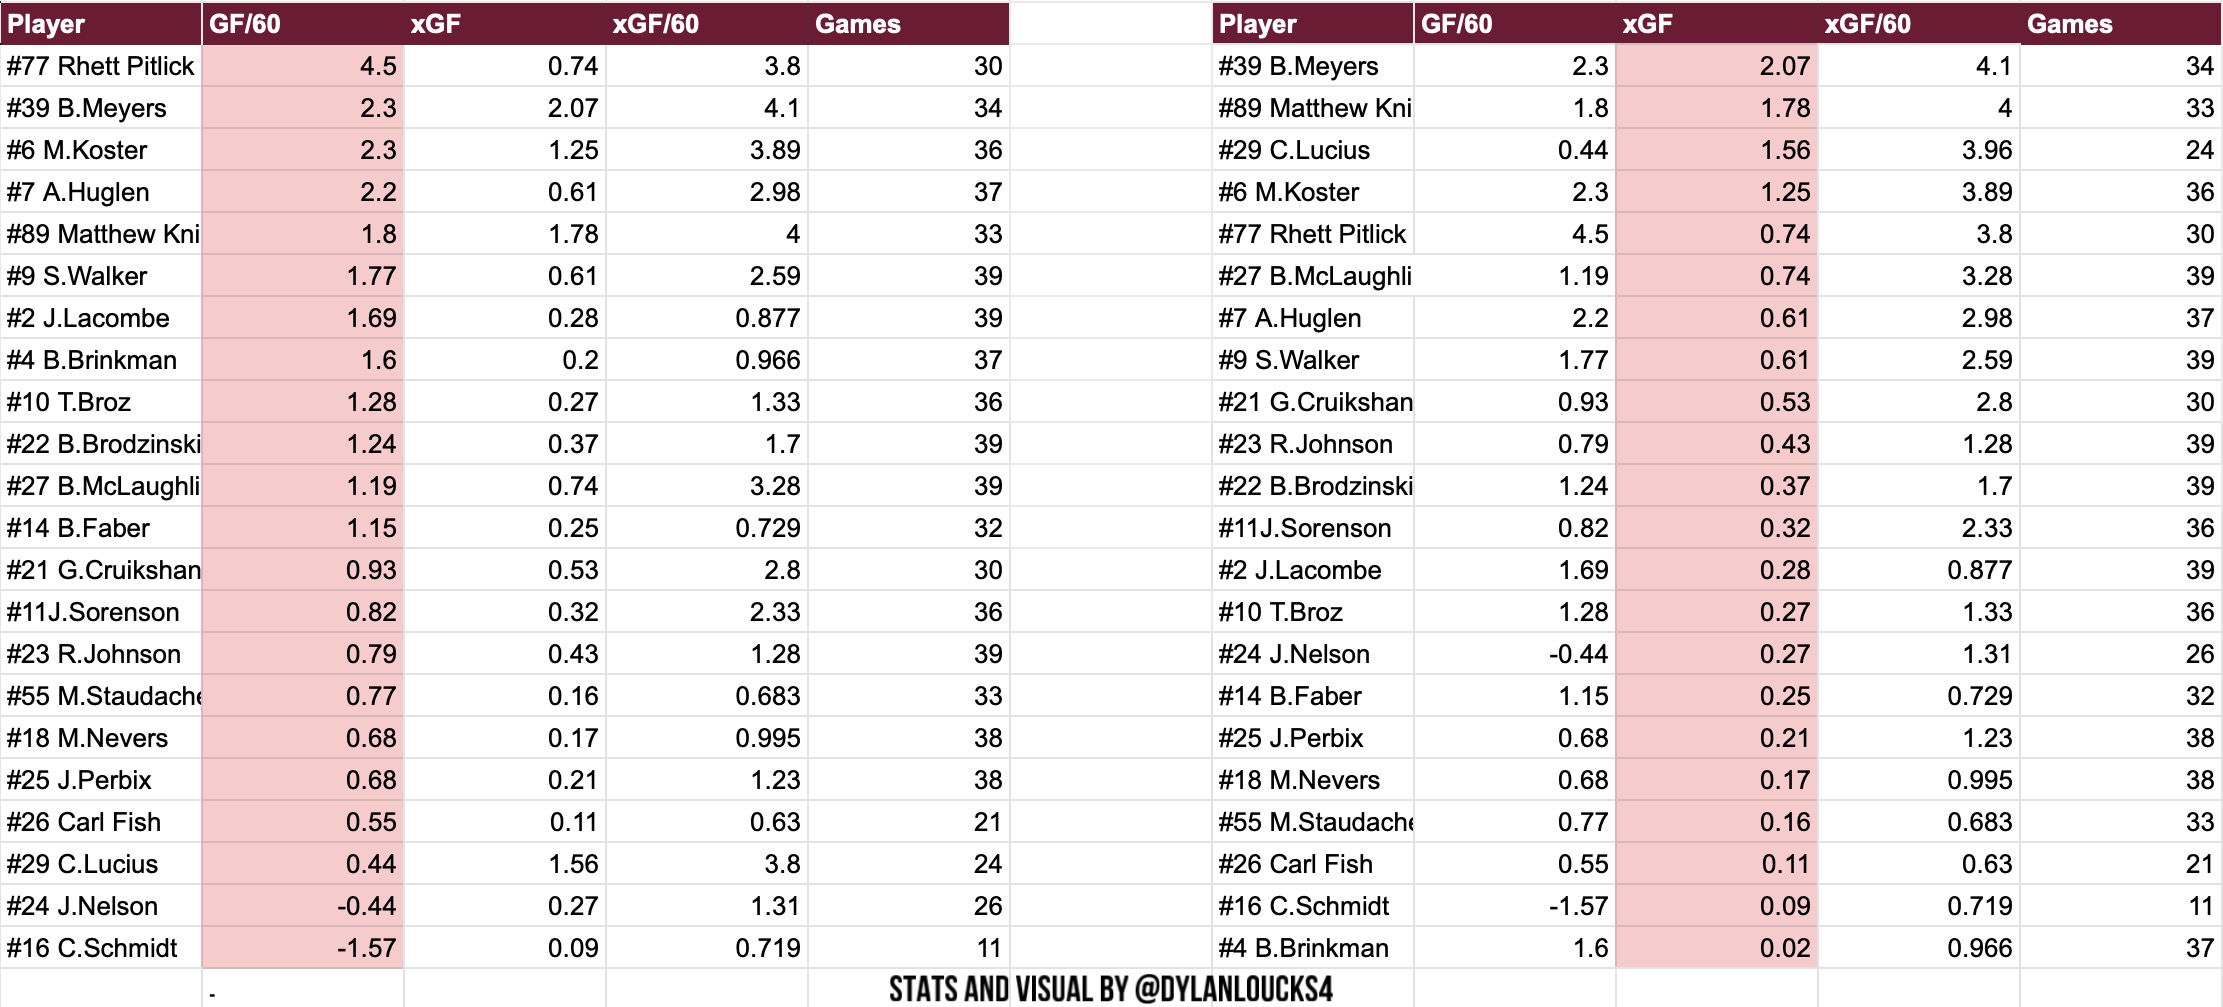
As you can see above, guys like Matthew Knies, Ben Meyers, Blake McLaughlin, Sammy Walker, and Chaz Lucius had very good seasons offensively, and the general goals and assist stats back those up. But guys like Aaron Huglen, Rhett Pitlick, and Grant Cruikshank had analytically great seasons but general stats didn’t back that up.
Pitlick had five goals in 30 games, Huglen had seven in 37 games, and Cruikshank had seven in 33 games. But analytically they provided a lot of offense for this team. Each of these three skaters played in the bottom-six of the Gophers team for much of the season yet they provided their linemates great chances to score with the amount of offense they created.
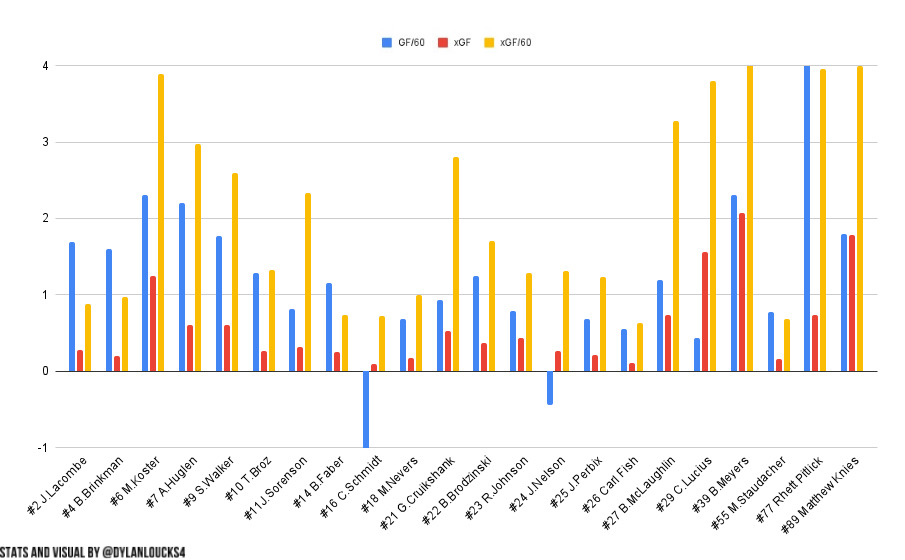
The main piece of my expected goals model is the xGF. I also put GF/60 and xGF/60 on the chart which are stats to determine a player’s offensive ability. xGF is a stat that examines shot quality in an attempt to guess the goal expectancy of players and teams. GF/60 is how many goals said player is on the ice for per 6o minutes and xGF/60 is the player’s xGF scaled to 60 minutes.
Ben Meyers led all Gopher forwards in xGF with (2.07, xGF/60 (4.01), and ranked second in GF/60 (2.3) behind Rhett Pitlick. Matthew Knies ranked second in xGF and xGF/60 he also ranked fourth among Gopher forwards in GF/60. Pitlick Ranked fourth in xGF and xGF/60. His 4.5 GF/60 ranked first on the team, 2.20 notches above Meyers’ 2.30.
Chaz Lucius ranked third in xGF and xGF/60. But his .44 GF/60 was the third-worst on the Gophers team. Huglen’s .61 xGF was tied with Sammy Walker for sixth on the team. Huglen ranked third in GF/60 and sixth in xGF/60 among Gopher forwards.
The top five offensive forward this season based on my model.
- Ben Meyers
- Matthew Knies
- Rhett Pitlick
- Chaz Lucius
- Blake McLaughlin
This is where you can pair analytics with the eye test. By watching this team you could conclude these are the five best Gophers in terms of creating offense. You also have guys like Walker, who recorded 27 points in 39 games, Huglen who recorded 16 points in 37 games, and Bryce Brodzinski who recorded 26 points in 39 games. You could make a case for these three to be included for the top five Gophers forwards but I’ve elected not to.
No line played more minutes together than the Brodzinski-Walker-McLaughlin line, which was called the PB&J line by players and coaches. Over 356 minutes played together was 188 more minutes than the next closest line, which was the Knies-Meyers-Lucius line. The top line of veterans scored 23 goals and notched 153 total shots when all on the ice together. They also have played on a line together for three straight seasons and have had a lot of success finishing each other’s chances.
The Broz-Huglen-Pitlick line scored four times together, were on the ice for zero goals against, and notched 28 total shots. But they only played 83 minutes together.
It was a small sample size but when Mason Nevers played with Huglen and Pitlick they scored three goals with only six shots on goal. This is a line combination you could see head coach Bob Motzko put together for next season. With only 90 shifts together and a total of 18 minutes the line cashed in three times and allowed zero.
Pitlick and Huglen both bounced around a lot playing with different centers and different wingers but they were most effective when used on the same line. Huglen would rank sixth on the list and Walker would rank seventh. Both Huglen and Pitlick were young freshmen who generated offense but didn’t finish at a high rate. You give these two time to grow and develop and they are 25-35 point players.
Defensive Metric
As stated above, halfway through the season I was trying to come up with some sort of defensive model that would tell me who the best defensive players were on this Gophers team. After trial and error, I decided to create a visual on four defensive metrics and call the visual EV Def. Which stands for Evolving Defense.
The four stats I used were CORSI/60, DZRT/60, TA/60, and PBW/60.
Corsi is an advanced statistic used to measure a players shot attempt differential while at even strength play. The Corsi number is calculated by taking the number of shot attempts his team gets at even strength while he is on the ice and dividing it by the number of shot attempts the opponent gets while he is on the ice.
DZRT/60 stands for defensive zone retrievals per 60 minutes. This could mean a player forces a turnover in the defensive zone and retrieves it or he picks up loose pucks in the corner. TA/60 stands for takeaways per 60 minutes and PBW/60 stands for puck battles won per 60 minutes.
I really like these stats because they can show a player’s aggressiveness to get to the dirty areas, retrievals in the defensive zone, and strength along the boards or open ice when it comes to puck battles.
The Results
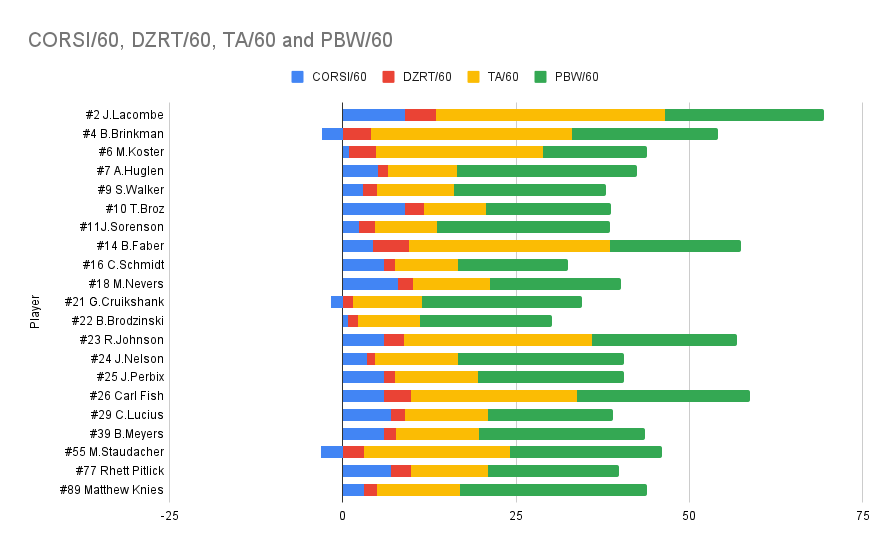
Jackson LaCombe led the team in assists and recorded 30 points on the backend in 39 games for the Gophers. Not only does he provide offense but he is a steady defender on the team. LaCombe was first on the team in CORSI/60 and Takeaways. He also ranked second in defensive zone retrievals and was tied for fifth in puck battles won per 60.
Besides LaCombe the Gophers relied a lot on Brock Faber and Ryan Johnson. Faber ranked sixth in CORSI and first in defensive zone retrievals. He also was tied for eight in puck battles won per 60 and was tied for second in takeaways with Ben Brinkman. Johnson ranked fourth in CORSI and was tied for seventh in defensive zone retrievals. He also ranked third in takeaways per 60 and was tied for seventh in puck battles won per 60.
Like LaCombe was on defense, Matthew Knies had the most complete season based on analytics. Knies was tied for second among forwards in takeaways and was first in puck battles won per 60 amongst all skaters. The most underrated player of the year award will have to be spilt between Aaron Huglen and Rhett Pitlick, both provided the Gophers with great defense and wonderful offense.
Huglen ranked fifth in CORSI per 60 amongst forwards and second overall in puck battles won per 60. Pitlick was tied for third overall in CORSI per 60 and ranked first amongst Gopher forwards in defensive zone retrievals.
Final Thoughts
1,700 words later we have come to a conclusion with the results. In terms of what to expect, I’d say watch out for Aaron Huglen and Rhett Pitlick as they will be in for some big years.
It’s hard losing guys like Meyers, McLaughlin, and Lucius but it leaves the door open for guys like Nevers, Huglen, Pitlick, and newer freshmen to step up.
With Faber, Johnson, LaCombe, and Mike Koster returning, the Gophers will yet again have a very strong top-four defensive group. Which will be rounded out with guys like Carl Fish, Matt Staudacher, and newcomers in Ryan Chelsey and Luke Mittelstadt.
Expected goals model, graphs, and stats are mine, defensive stats courtesy of InStatHockey, visual by Dylan Loucks goals, assists, points, plus-minus, shots, and blocks courtesy of University of Minnesota Athletics.