March 25th, 2024: The NCAA Tournament is set. The Gophers will travel to the Sioux Falls Regional to face off against the Omaha Mavericks. Here is a scouting report on the Mavericks.
–> Follow @Dylanloucks4 on Twitter

Minneapolis, Minn – The NCAA has announced the 16 teams competing in the College Hockey Tournament. The Gophers will travel to Sioux Falls and face off against the Nebraska-Omaha Mavericks in round one. Here is an in-depth scouting report on the Mavericks.
Omaha (23-12-4) have won 11 of their last 15 games and have gone 11-3-1 in that span, with a tie as well. The Mavericks are coming off a loss to the Denver Pioneers in the NCHC Championship game two days ago but have been playing great hockey recently. They have been led this season by their top line which includes freshman forward Tanner Ludtke.
The Minnesota born forward has 11 goals and 28 points in 38 games this season. Omaha has picked up a lot of scoring from other lines though. They currently have four players with double-digit goals and six players with 20 or more points this season.
Despite losing to Denver in the NCHC Championship on Saturday, the Mavericks will enter Sioux Falls, to face the Gophers, on fire. They got outshot 35-16 against the Pioneers but the Mavericks held their own against North Dakota to get to the Championship game. They beat the Fighting Hawks 6-3 despite being outshot 39-35 in that game.

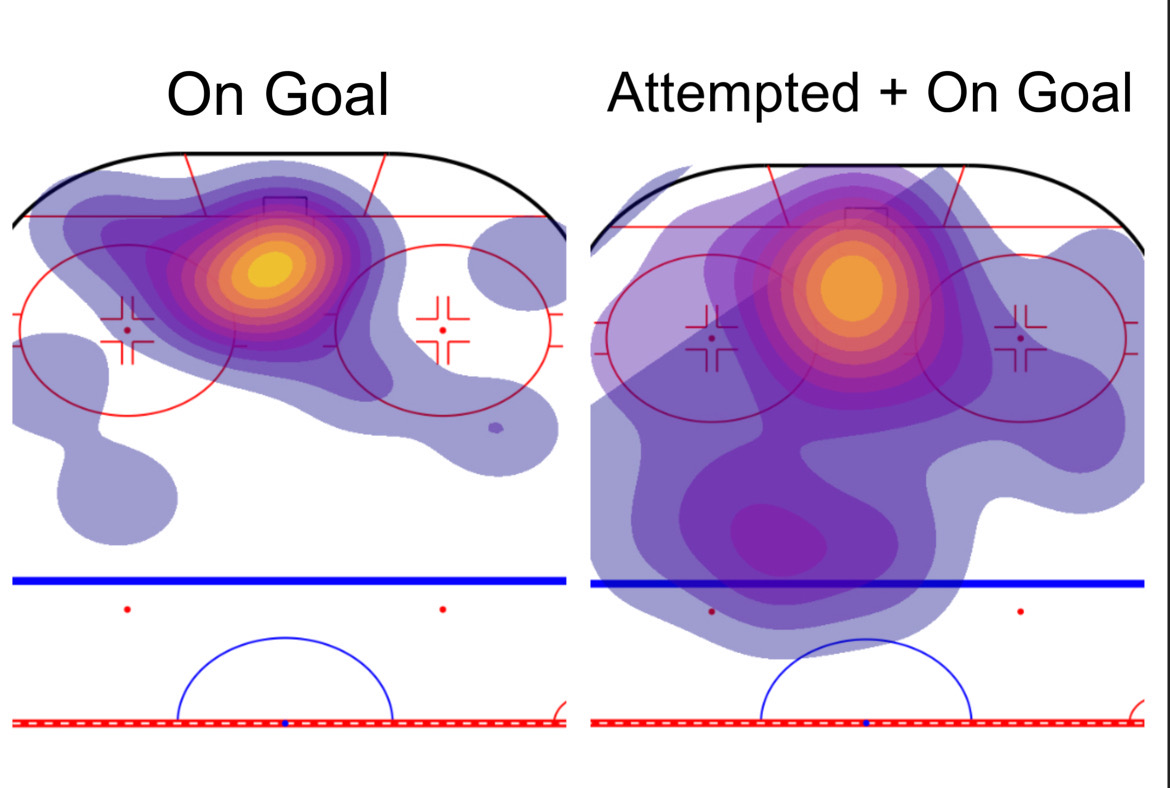
Above is a photo of the Mavericks’ shot chart from their last game. They only got 16 shots on net with 36 attempted. As you can see, most of their shots came right in front of the net. They attempted many perimeter shots but many of them were blocked or just missed the net.
Omaha attempted six shots from the point but all six got blocked. They attempted five shots outside the face-off circle and four of the five were blocked. The only one that wasn’t blocked, hit the post. The Mavericks only got two shots on net between the top of the circles to the blue line on 11 attempted in their last game against Denver.

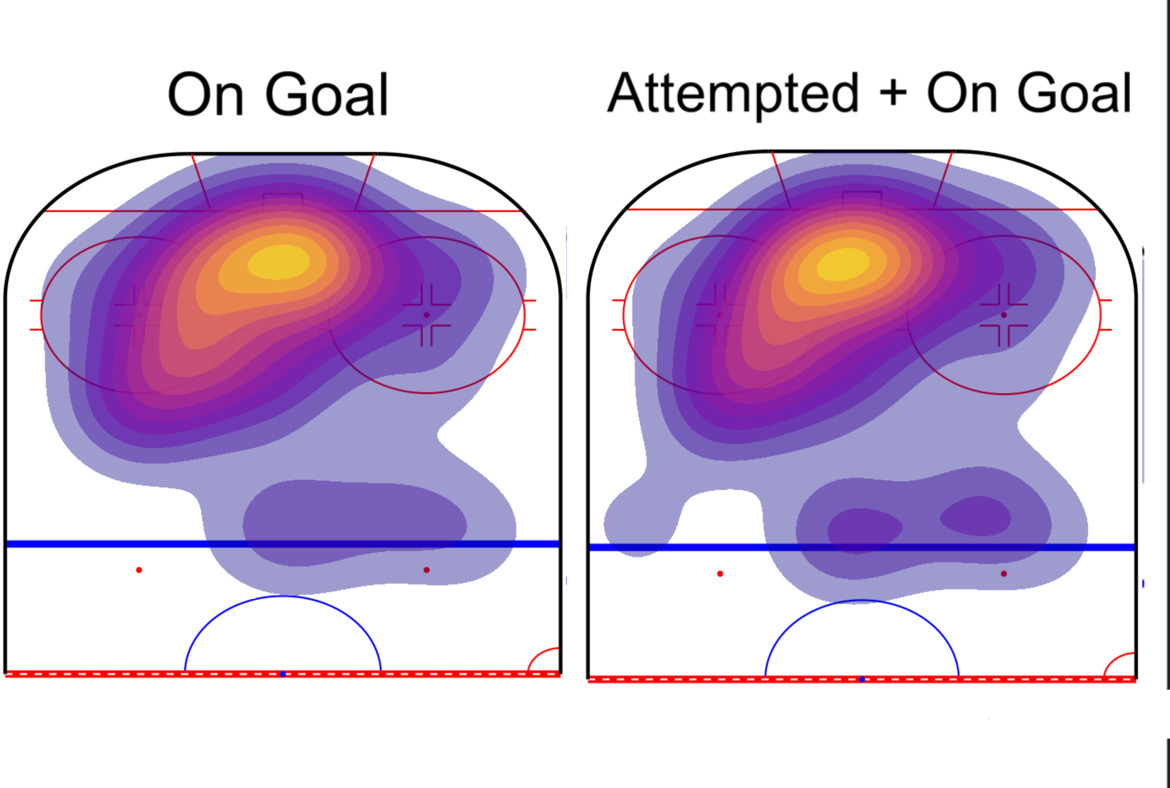
Above is a photo of the Mavericks’ shot chart from their game against North Dakota on 3/22/24. They won this game 6-3. In this game they recorded 35 shots on the net on 57 attempted. They took seven shots from the blue line and got four of them on net. In this game the Mavericks didn’t take many perimeter shots but that was likely because everything they shot hit the net.
The home plate area in hockey is very important for getting high quality chances. The best scoring chances usually come in this area. Draw a line from the left post to the left face-off dot. Then draw a line from the left face-off dot to the right one then back to the right post. It will look like a home plate from baseball. Or an upside down triangle. Whatever you want to call it, your best chances to score usually comes in this area.
In their game against North Dakota, Omaha had 14 of their 35 total shots in the home plate area. They essentially only recorded four perimeter shots and all of their other shots came between the two circles. They attacked the net hard and threw everything they could on net when they were in that area.
This might’ve been because North Dakota was playing their freshman goaltender but nonetheless it was a smart game plan by Omaha. I do not have access to watch other games from Omaha this season so I only have results on their last two games, which were in the NCHC Tournament in St. Paul.
Let’s move on to Omaha’s systems
The Mavericks’ neutral zone forecheck seemed to be a 1-2-2 in the two games I watched.
The defensemen defend the rush 2v2 and don’t go past the neutral zone face-off dots. The forwards attack quickly. F1 will pressure the puck carrier with F2 and F3 providing pressure near the red line to force icings and dump-ins. Occasionally D1 would move up from his spot to form a 1-3-1 but Omaha mainly used a 1-2-2.
Omaha’s penalty kill currently sits at 77 percent which ranks 45th in the entire NCAA. They have allowed 27 power play goals this season. Their power play percentage sits at 18.4 which is 42nd in the NCAA. They have scored 25 power play goals on 136 attempted.
Their PK formation is 2-2 box.
Both forwards will play between the two circles when the play is in the middle of the ice. Once it shifts over to the left or the right side they move. F1 will keep his eye on the guy on the point and D1 will stare down the puck carrier. F2 will slide down a bit to the slot to try and intercept passes from the middle but once it moves to the right side he becomes F1.

The forwards in this, pressure the puck high 2v2 to prevent the power play from setting up. The defensemen play 2v3 zone coverage and take away passing lanes in front of the net.
Their forecheck on the PK is a 1-1-2 and quickly turns into a 2-2 in the neutral zone. F1 will attack the puck carrier with F2 behind him but once the play retreats to the neutral zone it’s a 2-2 to try and stop the power play from entering the zone. Their power play set up is like every other team. A 1-3-1.
The photo above is an example of their penalty kill. As you can see in this scenario, the power play set up isn’t creating much in terms of any high danger looks. D1 and D2 in the image are the forwards and D3 and D4 are the defensemen.
Omaha’s penalty kill formation is good for teams who like to move the puck around and wait for shooting lanes, or better shooting lanes. North Dakota found a way to exploit the Maverick’s PK by just firing a point shot on net for a tip. Point shots by Ryan Chesley, Sam Rinzel, or Mike Koster might be a way to exploit the Mavericks’ PK. Especially with 6-foot-4 center Jaxon Nelson standing in front.
Defensive Rush Data

Lastly, we will look at some defensive rush data I tracked on Omaha. It seems they like to use their top two pairs a lot and play Senior defender Nolan Krenzen a lot. Krenzen would take regular shifts with Joaquim Lemay then Kirby Proctor and Victor Mancini would hope over the boards. After they would come off, Krenzen would go out again but this time with Dom Vidoli.
I don’t want to say they shelter their third pair a bit with less minutes with Griffin Ludtke and Jacob Guevin because I only watched two games. Plus Ludtke leads their blue line in points and is second on the entire team in points behind his brother Tanner.
But the Mavericks have a great d-core. They played seven defensemen in both games and rotated all three of their pairings. In the two games I tracked, Krenzen and Guevin stopped the most chances off the rush that resulted in no shots. Guevin was 13-for-19 with having allowed six shots off the rush. Krenzen was 13-for-22.
Proctor went 8-for-11, his usual d-partner Mancini, went 9-for-13. Lemay went 9-for-12, Ludtke went 12-for-16, and Vidoli went 10-for-15. Six out of the seven defensemen allowed two high danger chances off the rush. Vidoli is the only Maverick defender who didn’t in the two game sample.

Above is a chart. Looks better than explaining.
Boston University is the one-seed in the Sioux Falls regional. They play Rochester Institute of Technology, also known as RIT. The winner of BU vs RIT will play the winner of Minnesota vs Omaha in the regional final. The winner of the regional final will punch their ticket to St. Paul for the NCAA Frozen Four.